Search for Indicators
LIFE in Our Community
Strong LIFE in Our Community means community leadership makes decisions in the best long-term interests of residents. All people are valued members of the community, experience a sense of community and belonging, do not experience discrimination, have full access to services, are informed on community issues, can participate fully through such opportunities as voting, volunteer work, leadership and faith groups and experience infrastructure and amenities promoting a high quality of life.
The following were identified in the 2021 Brown County LIFE Study:
-- We are seeing diversity at an increasing rate along with overall population growth.
-- Community leaders are optimistic that Brown County is improving over time.
-- Community members are less optimistic about Brown County improvement of the next five years.
Below are relevant data indicators to provide additional context.
Indicator Gauge Icon Legend
Legend Colors
Red is bad, green is good, blue is not statistically different/neutral.
Compared to Distribution
 the value is in the best half of communities.
 the value is in the 2nd worst quarter of communities.
 the value is in the worst quarter of communities.
Compared to Target
 meets target;
  does not meet target.
Compared to a Single Value
 lower than the comparison value;
 higher than the comparison value;
 not statistically different from comparison value.
Trend

 non-significant change over time;
 significant change over time;
  no change over time.
Compared to Prior Value
 higher than the previous measurement period;
 lower than the previous measurement period;
 no statistically different change from previous measurement period.
LIFE Study Data
LIFE Study Data
How would you rate the Brown County area in terms of as a place where people of different cultural/racial/ethnic backgrounds get along well?
Value
Compared to:
How would you rate the Brown County area in terms of as a place where people of different cultural/racial/ethnic backgrounds get along well? County: Brown
How would you rate the Brown County area in terms of as a place where people of different cultural/racial/ethnic backgrounds get along well? County: Brown
33.0%
(2021)
Compared to:

Prior Value
(43.0%)
Prior Value compares a measured value with the previously measured value. Confidence intervals were not taken into account in determining the direction of the comparison.
LIFE Study Data
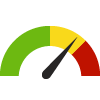
How would you rate the Brown County area in terms of building a strong economy?
Value
Compared to:
How would you rate the Brown County area in terms of building a strong economy? County: Brown
How would you rate the Brown County area in terms of building a strong economy? County: Brown
72.0%
(2021)
Compared to:
Prior Value
(76.0%)
Prior Value compares a measured value with the previously measured value. Confidence intervals were not taken into account in determining the direction of the comparison.
LIFE Study Data
How would you rate the Brown County area in terms of a place where the spiritual health of residents is nurtured?
Value
Compared to:
How would you rate the Brown County area in terms of a place where the spiritual health of residents is nurtured? County: Brown
How would you rate the Brown County area in terms of a place where the spiritual health of residents is nurtured? County: Brown
55.0%
(2021)
Compared to:
Prior Value
(73.0%)
Prior Value compares a measured value with the previously measured value. Confidence intervals were not taken into account in determining the direction of the comparison.
LIFE Study Data
How would you rate the Brown County area in terms of living together as neighbors?
Value
Compared to:
How would you rate the Brown County area in terms of living together as neighbors? County: Brown
How would you rate the Brown County area in terms of living together as neighbors? County: Brown
67.0%
(2021)
Compared to:
Prior Value
(81.0%)
Prior Value compares a measured value with the previously measured value. Confidence intervals were not taken into account in determining the direction of the comparison.
LIFE Study Data
How would you rate the Brown County area in terms of social acceptance of gay, lesbian, bisexual, transgender, and queer people?
Value
Compared to:
How would you rate the Brown County area in terms of social acceptance of gay, lesbian, bisexual, transgender, and queer people? County: Brown
How would you rate the Brown County area in terms of social acceptance of gay, lesbian, bisexual, transgender, and queer people? County: Brown
62.0%
(2021)
Compared to:

US Value
(72%)
LIFE Study Data
How would you rate the Brown County area in terms of the overall quality of public services (trash collection, roads, drinking water, recycling, etc.)?
Value
Compared to:
How would you rate the Brown County area in terms of the overall quality of public services (trash collection, roads, drinking water, recycling, etc.)? County: Brown
How would you rate the Brown County area in terms of the overall quality of public services (trash collection, roads, drinking water, recycling, etc.)? County: Brown
82.0%
(2021)
Compared to:
Prior Value
(86.0%)
Prior Value compares a measured value with the previously measured value. Confidence intervals were not taken into account in determining the direction of the comparison.
LIFE Study Data
How would you rate the Brown County area in terms of the overall transportation system (roads, traffic, bus service, bike trails) in meeting your needs to get to work?
Value
Compared to:
How would you rate the Brown County area in terms of the overall transportation system (roads, traffic, bus service, bike trails) in meeting your needs to get to work? County: Brown
How would you rate the Brown County area in terms of the overall transportation system (roads, traffic, bus service, bike trails) in meeting your needs to get to work? County: Brown
47.0%
(2021)
Compared to:
Prior Value
(66.0%)
Prior Value compares a measured value with the previously measured value. Confidence intervals were not taken into account in determining the direction of the comparison.
LIFE Study Data
How would you rate the Brown County area in terms of affordability of adequate housing to meet our needs?
Value
Compared to:
How would you rate the Brown County area in terms of affordability of adequate housing to meet our needs? County: Brown
How would you rate the Brown County area in terms of affordability of adequate housing to meet our needs? County: Brown
7.0%
(2021)
Compared to:
Prior Value
(3.0%)
Prior Value compares a measured value with the previously measured value. Confidence intervals were not taken into account in determining the direction of the comparison.
National/ State/ Regional Data
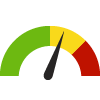
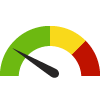
People 65+ Living Alone County: Brown
People 65+ Living Alone County: Brown
30.9%
(2018-2022)
Compared to:


WI Counties
The distribution is based on data from 72 Wisconsin counties.
U.S. Counties
The distribution is based on data from 3,133 U.S. counties and county equivalents.
WI Value
(29.3%)
The regional value is compared to the Wisconsin State value.
US Value
(26.4%)
The regional value is compared to the national value.
Trend
This comparison measures the indicator’s values over multiple time periods.<br>The Mann-Kendall Test for Statistical Significance is used to evaluate the trend<br>over 4 to 10 periods of measure, subject to data availability and comparability.
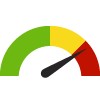
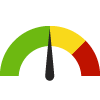
Mean Travel Time to Work County: Brown
Mean Travel Time to Work County: Brown
18.7
Minutes
(2018-2022)
Compared to:
WI Counties
The distribution is based on data from 72 Wisconsin counties.
U.S. Counties
The distribution is based on data from 3,131 U.S. counties and county equivalents.
WI Value
(22.2)
The regional value is compared to the Wisconsin State value.
US Value
(26.7)
The regional value is compared to the national value.
Trend
This comparison measures the indicator’s values over multiple time periods.<br>The Mann-Kendall Test for Statistical Significance is used to evaluate the trend<br>over 4 to 10 periods of measure, subject to data availability and comparability.
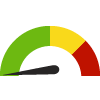
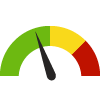
Homeownership County: Brown
Homeownership County: Brown
62.4%
(2018-2022)
Compared to:
WI Counties
The distribution is based on data from 72 Wisconsin counties.
U.S. Counties
The distribution is based on data from 3,133 U.S. counties and county equivalents.
WI Value
(60.0%)
The regional value is compared to the Wisconsin State value.
US Value
(57.8%)
The regional value is compared to the national value.
Trend
This comparison measures the indicator’s values over multiple time periods.<br>The Mann-Kendall Test for Statistical Significance is used to evaluate the trend<br>over 4 to 10 periods of measure, subject to data availability and comparability.
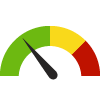
Median Household Income County: Brown
Median Household Income County: Brown
$74,066
(2018-2022)
Compared to:
WI Counties
The distribution is based on data from 72 Wisconsin counties.
U.S. Counties
The distribution is based on data from 3,132 U.S. counties and county equivalents.
WI Value
($72,458)
The regional value is compared to the Wisconsin State value.
US Value
($75,149)
The regional value is compared to the national value.
Trend
This comparison measures the indicator’s values over multiple time periods.<br>The Mann-Kendall Test for Statistical Significance is used to evaluate the trend<br>over 4 to 10 periods of measure, subject to data availability and comparability.
Per Capita Income County: Brown
Per Capita Income County: Brown
$39,091
(2018-2022)
Compared to:
WI Counties
The distribution is based on data from 72 Wisconsin counties.
U.S. Counties
The distribution is based on data from 3,133 U.S. counties and county equivalents.
WI Value
($40,130)
The regional value is compared to the Wisconsin State value.
US Value
($41,261)
The regional value is compared to the national value.
Trend
This comparison measures the indicator’s values over multiple time periods.<br>The Mann-Kendall Test for Statistical Significance is used to evaluate the trend<br>over 4 to 10 periods of measure, subject to data availability and comparability.
Children Living Below Poverty Level County: Brown
Children Living Below Poverty Level County: Brown
12.3%
(2018-2022)
Compared to:
WI Counties
The distribution is based on data from 72 Wisconsin counties.
U.S. Counties
The distribution is based on data from 3,132 U.S. counties and county equivalents.
WI Value
(13.3%)
The regional value is compared to the Wisconsin State value.
US Value
(16.7%)
The regional value is compared to the national value.
Trend
This comparison measures the indicator’s values over multiple time periods.<br>The Mann-Kendall Test for Statistical Significance is used to evaluate the trend<br>over 4 to 10 periods of measure, subject to data availability and comparability.
People Living Below Poverty Level County: Brown
People Living Below Poverty Level County: Brown
9.7%
(2018-2022)
Compared to:
WI Counties
The distribution is based on data from 72 Wisconsin counties.
U.S. Counties
The distribution is based on data from 3,133 U.S. counties and county equivalents.
WI Value
(10.7%)
The regional value is compared to the Wisconsin State value.
US Value
(12.5%)
The regional value is compared to the national value.
Trend
This comparison measures the indicator’s values over multiple time periods.<br>The Mann-Kendall Test for Statistical Significance is used to evaluate the trend<br>over 4 to 10 periods of measure, subject to data availability and comparability.
HP 2030 Target
(8.0%)
People 25+ with a Bachelor's Degree or Higher County: Brown
People 25+ with a Bachelor's Degree or Higher County: Brown
31.7%
(2018-2022)
Compared to:
WI Counties
The distribution is based on data from 72 Wisconsin counties.
U.S. Counties
The distribution is based on data from 3,133 U.S. counties and county equivalents.
WI Value
(32.0%)
The regional value is compared to the Wisconsin State value.
US Value
(34.3%)
The regional value is compared to the national value.
Trend
This comparison measures the indicator’s values over multiple time periods.<br>The Mann-Kendall Test for Statistical Significance is used to evaluate the trend<br>over 4 to 10 periods of measure, subject to data availability and comparability.
Mortgaged Owners Median Monthly Household Costs County: Brown
Mortgaged Owners Median Monthly Household Costs County: Brown
$1,509
(2018-2022)
Compared to:

WI Counties
The distribution is based on data from 72 Wisconsin counties.
WI Value
($1,602)
The regional value is compared to the Wisconsin State value.
US Value
($1,828)
The regional value is compared to the national value.
Trend
This comparison measures the indicator’s values over multiple time periods.<br>The Mann-Kendall Test for Statistical Significance is used to evaluate the trend<br>over 4 to 10 periods of measure, subject to data availability and comparability.
People 25+ with a High School Diploma or Higher County: Brown
People 25+ with a High School Diploma or Higher County: Brown
92.9%
(2018-2022)
Compared to:
WI Counties
The distribution is based on data from 72 Wisconsin counties.
U.S. Counties
The distribution is based on data from 3,133 U.S. counties and county equivalents.
WI Value
(93.1%)
The regional value is compared to the Wisconsin State value.
US Value
(89.1%)
The regional value is compared to the national value.
Trend
This comparison measures the indicator’s values over multiple time periods.<br>The Mann-Kendall Test for Statistical Significance is used to evaluate the trend<br>over 4 to 10 periods of measure, subject to data availability and comparability.
National/ State/ Regional Data
Median Monthly Owner Costs for Households without a Mortgage
Value
Compared to:
Median Monthly Owner Costs for Households without a Mortgage County: Brown
Median Monthly Owner Costs for Households without a Mortgage County: Brown
$581
(2018-2022)
Compared to:
WI Counties
The distribution is based on data from 72 Wisconsin counties.
WI Value
($624)
The regional value is compared to the Wisconsin State value.
US Value
($584)
The regional value is compared to the national value.
Trend
This comparison measures the indicator’s values over multiple time periods.<br>The Mann-Kendall Test for Statistical Significance is used to evaluate the trend<br>over 4 to 10 periods of measure, subject to data availability and comparability.
