Search for Indicators

LIFE of Self-Sufficiency
A LIFE of Self-Sufficiency means community members of all ages, income, and ability levels have enough nutritious food daily to go without hunger, access to emergency services such as financial support, rental assistance, food pantries, short-term shelter and utility assistance, and access to reliable transportation, affordable and quality housing, legal services, and accurate information and referral to needed services.
The following were identified in the 2021 Brown County LIFE Study:
-- The limited housing stock is of high quality.
-- There is low unemployment.
-- Transportation and access is limited, as is support for the elderly to age at home and maintain independence.
-- There are significant barriers to escaping poverty, including wages, transportation, and quality childcare.
-- We are lacking adequate and affordable housing for families with low income.
Below are relevant data indicators to provide additional context.
Indicator Gauge Icon Legend
Legend Colors
Red is bad, green is good, blue is not statistically different/neutral.
Compared to Distribution
 the value is in the best half of communities.
 the value is in the 2nd worst quarter of communities.
 the value is in the worst quarter of communities.
Compared to Target
 meets target;
  does not meet target.
Compared to a Single Value
 lower than the comparison value;
 higher than the comparison value;
 not statistically different from comparison value.
Trend

 non-significant change over time;
 significant change over time;
  no change over time.
Compared to Prior Value
 higher than the previous measurement period;
 lower than the previous measurement period;
 no statistically different change from previous measurement period.
LIFE Study Data
LIFE Study Data
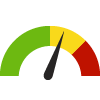
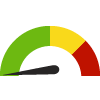
How would you rate the Brown County area in terms of a place that meets the employment needs of you and your family?
Value
Compared to:
How would you rate the Brown County area in terms of a place that meets the employment needs of you and your family? County: Brown
How would you rate the Brown County area in terms of a place that meets the employment needs of you and your family? County: Brown
68.0%
(2021)
Compared to:

Prior Value
(72.0%)
Prior Value compares a measured value with the previously measured value. Confidence intervals were not taken into account in determining the direction of the comparison.
LIFE Study Data
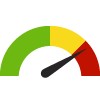
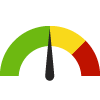
How would you rate the Brown County area in terms of a place where people with low incomes can meet their basic needs for things such as food and housing?
Value
Compared to:
How would you rate the Brown County area in terms of a place where people with low incomes can meet their basic needs for things such as food and housing? County: Brown
How would you rate the Brown County area in terms of a place where people with low incomes can meet their basic needs for things such as food and housing? County: Brown
38.0%
(2021)
Compared to:
Prior Value
(41.0%)
Prior Value compares a measured value with the previously measured value. Confidence intervals were not taken into account in determining the direction of the comparison.
LIFE Study Data
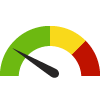
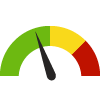
How would you rate the Brown County area in terms of affordability of adequate housing to meet our needs?
Value
Compared to:
How would you rate the Brown County area in terms of affordability of adequate housing to meet our needs? County: Brown
How would you rate the Brown County area in terms of affordability of adequate housing to meet our needs? County: Brown
7.0%
(2021)
Compared to:
Prior Value
(3.0%)
Prior Value compares a measured value with the previously measured value. Confidence intervals were not taken into account in determining the direction of the comparison.
LIFE Study Data
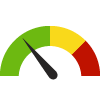
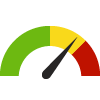
How would you rate the Brown County area in terms of caring for vulnerable persons (like children, the elderly, and persons with disabilities)?
Value
Compared to:
How would you rate the Brown County area in terms of caring for vulnerable persons (like children, the elderly, and persons with disabilities)? County: Brown
How would you rate the Brown County area in terms of caring for vulnerable persons (like children, the elderly, and persons with disabilities)? County: Brown
54.0%
(2021)
Compared to:
Prior Value
(64.0%)
Prior Value compares a measured value with the previously measured value. Confidence intervals were not taken into account in determining the direction of the comparison.
LIFE Study Data
How would you rate the Brown County area in terms of family unable to get mental health care they needed?
Value
Compared to:
How would you rate the Brown County area in terms of family unable to get mental health care they needed? County: Brown
How would you rate the Brown County area in terms of family unable to get mental health care they needed? County: Brown
10.0%
(2021)
Compared to:
Prior Value
(6.0%)
Prior Value compares a measured value with the previously measured value. Confidence intervals were not taken into account in determining the direction of the comparison.
LIFE Study Data
How would you rate the Brown County area in terms of meeting the overall needs of the poor?
Value
Compared to:
How would you rate the Brown County area in terms of meeting the overall needs of the poor? County: Brown
How would you rate the Brown County area in terms of meeting the overall needs of the poor? County: Brown
44.0%
(2021)
Compared to:
Prior Value
(58.0%)
Prior Value compares a measured value with the previously measured value. Confidence intervals were not taken into account in determining the direction of the comparison.
LIFE Study Data
How would you rate the Brown County area in terms of providing quality affordable child care?
Value
Compared to:
How would you rate the Brown County area in terms of providing quality affordable child care? County: Brown
How would you rate the Brown County area in terms of providing quality affordable child care? County: Brown
29.0%
(2021)
Compared to:
Prior Value
(31.0%)
Prior Value compares a measured value with the previously measured value. Confidence intervals were not taken into account in determining the direction of the comparison.
LIFE Study Data
How would you rate the Brown County area in terms of the overall transportation system (roads, traffic, bus service, bike trails) in meeting your needs to get to work?
Value
Compared to:
How would you rate the Brown County area in terms of the overall transportation system (roads, traffic, bus service, bike trails) in meeting your needs to get to work? County: Brown
How would you rate the Brown County area in terms of the overall transportation system (roads, traffic, bus service, bike trails) in meeting your needs to get to work? County: Brown
47.0%
(2021)
Compared to:
Prior Value
(66.0%)
Prior Value compares a measured value with the previously measured value. Confidence intervals were not taken into account in determining the direction of the comparison.
National/ State/ Regional Data
People 65+ Living Alone County: Brown
People 65+ Living Alone County: Brown
30.9%
(2018-2022)
Compared to:


WI Counties
The distribution is based on data from 72 Wisconsin counties.
U.S. Counties
The distribution is based on data from 3,133 U.S. counties and county equivalents.
WI Value
(29.3%)
The regional value is compared to the Wisconsin State value.
US Value
(26.4%)
The regional value is compared to the national value.
Trend
This comparison measures the indicator’s values over multiple time periods.<br>The Mann-Kendall Test for Statistical Significance is used to evaluate the trend<br>over 4 to 10 periods of measure, subject to data availability and comparability.
Households with an Internet Subscription County: Brown
Households with an Internet Subscription County: Brown
89.9%
(2018-2022)
Compared to:
WI Counties
The distribution is based on data from 72 Wisconsin counties.
U.S. Counties
The distribution is based on data from 3,133 U.S. counties and county equivalents.
WI Value
(88.1%)
The regional value is compared to the Wisconsin State value.
US Value
(88.5%)
The regional value is compared to the national value.
Trend
This comparison measures the indicator’s values over multiple time periods.<br>The Mann-Kendall Test for Statistical Significance is used to evaluate the trend<br>over 4 to 10 periods of measure, subject to data availability and comparability.
National/ State/ Regional Data
Households with One or More Types of Computing Devices
Value
Compared to:
Households with One or More Types of Computing Devices County: Brown
Households with One or More Types of Computing Devices County: Brown
93.9%
(2018-2022)
Compared to:

WI Counties
The distribution is based on data from 72 Wisconsin counties.
U.S. Counties
The distribution is based on data from 3,133 U.S. counties and county equivalents.
WI Value
(92.9%)
The regional value is compared to the Wisconsin State value.
US Value
(94.0%)
The regional value is compared to the national value.
Trend
This comparison measures the indicator’s values over multiple time periods.<br>The Mann-Kendall Test for Statistical Significance is used to evaluate the trend<br>over 4 to 10 periods of measure, subject to data availability and comparability.
Population 16+ in Civilian Labor Force County: Brown
Population 16+ in Civilian Labor Force County: Brown
66.3%
(2018-2022)
Compared to:

WI Counties
The distribution is based on data from 72 Wisconsin counties.
U.S. Counties
The distribution is based on data from 3,133 U.S. counties and county equivalents.
WI Value
(63.4%)
The regional value is compared to the Wisconsin State value.
US Value
(59.6%)
The regional value is compared to the national value.
Trend
This comparison measures the indicator’s values over multiple time periods.<br>The Mann-Kendall Test for Statistical Significance is used to evaluate the trend<br>over 4 to 10 periods of measure, subject to data availability and comparability.
Unemployed Workers in Civilian Labor Force County: Brown
Unemployed Workers in Civilian Labor Force County: Brown
2.4%
(January 2024)
Compared to:
WI Counties
The distribution is based on data from 72 Wisconsin counties.
U.S. Counties
The distribution is based on non-seasonally-adjusted data from 3,140 U.S. counties and county equivalents.
WI Value
(2.8%)
The regional value is compared to the Wisconsin State value.
US Value
(4.1%)
The regional value is compared to the national value.
Prior Value
(2.6%)
Prior Value compares a measured value with the previously measured value. Confidence intervals were not taken into account in determining the direction of the comparison.
Trend
This comparison measures the indicator’s values over multiple time periods.<br>The Mann-Kendall Test for Statistical Significance is used to evaluate the trend<br>over 4 to 10 periods of measure, subject to data availability and comparability.
Homeownership County: Brown
Homeownership County: Brown
62.4%
(2018-2022)
Compared to:
WI Counties
The distribution is based on data from 72 Wisconsin counties.
U.S. Counties
The distribution is based on data from 3,133 U.S. counties and county equivalents.
WI Value
(60.0%)
The regional value is compared to the Wisconsin State value.
US Value
(57.8%)
The regional value is compared to the national value.
Trend
This comparison measures the indicator’s values over multiple time periods.<br>The Mann-Kendall Test for Statistical Significance is used to evaluate the trend<br>over 4 to 10 periods of measure, subject to data availability and comparability.
People Living Below Poverty Level County: Brown
People Living Below Poverty Level County: Brown
9.7%
(2018-2022)
Compared to:
WI Counties
The distribution is based on data from 72 Wisconsin counties.
U.S. Counties
The distribution is based on data from 3,133 U.S. counties and county equivalents.
WI Value
(10.7%)
The regional value is compared to the Wisconsin State value.
US Value
(12.5%)
The regional value is compared to the national value.
Trend
This comparison measures the indicator’s values over multiple time periods.<br>The Mann-Kendall Test for Statistical Significance is used to evaluate the trend<br>over 4 to 10 periods of measure, subject to data availability and comparability.
HP 2030 Target
(8.0%)
Social Associations County: Brown
Social Associations County: Brown
8.2
Membership associations per 10,000 population
(2021)
Compared to:
WI Counties
The distribution is based on data from 72 Wisconsin counties.
U.S. Counties
The distribution is based on data from 3,141 U.S. counties and county equivalents.
WI Value
(11.0)
The regional value is compared to the Wisconsin State value.
US Value
(9.1)
The regional value is compared to the national value.
Prior Value
(8.2)
Prior Value compares a measured value with the previously measured value. Confidence intervals were not taken into account in determining the direction of the comparison.
Trend
This comparison measures the indicator’s values over multiple time periods.<br>The Mann-Kendall Test for Statistical Significance is used to evaluate the trend<br>over 4 to 10 periods of measure, subject to data availability and comparability.
Adults who are Sedentary County: Brown
Adults who are Sedentary County: Brown
19.5%
(2020-2022)
Compared to:
WI Counties
The distribution is based on data from 57 Wisconsin counties.
WI Value
(20.2%)
The regional value is compared to the Wisconsin State value.
Prior Value
(14.6%)
Prior Value compares a measured value with the previously measured value. Confidence intervals were taken into account in determining the direction of the comparison.
Trend
This comparison measures the indicator’s values over multiple time periods.<br>The Mann-Kendall Test for Statistical Significance is used to evaluate the trend<br>over 4 to 10 periods of measure, subject to data availability and comparability.
HP 2020 Target
(32.6%)
HP 2030 Target
(21.8%)
