Search for Indicators
A Healthy LIFE

A HEALTHY LIFE is measured through community members who practice healthy lifestyles: have a balanced diet, exercise routinely, engage in activities in support of good mental health, do not abuse tobacco, drugs, or alcohol, have routine health screenings such as blood pressure checks, and have access to dental, mental, physical, and medical professionals.
The following were identified in the 2021 Brown County LIFE Study:
- Perception of quality health care in Brown County remains positive.
- Community collaboration to combat health problems is an emerging area of strength in Brown County.
- Alcohol use remains an area of great concern.
- Few see Brown County as a place encouraging healthy habits, and many see significant room for improvement for elder health and health of disadvantaged populations.
- Obesity and overweight health issues remain a general community challenge.
Below are relevant data indicators to provide additional context.
Indicator Gauge Icon Legend
Legend Colors
Red is bad, green is good, blue is not statistically different/neutral.
Compared to Distribution
 the value is in the best half of communities.
 the value is in the 2nd worst quarter of communities.
 the value is in the worst quarter of communities.
Compared to Target
 meets target;
  does not meet target.
Compared to a Single Value
 lower than the comparison value;
 higher than the comparison value;
 not statistically different from comparison value.
Trend

 non-significant change over time;
 significant change over time;
  no change over time.
Compared to Prior Value
 higher than the previous measurement period;
 lower than the previous measurement period;
 no statistically different change from previous measurement period.
LIFE Study Data
LIFE Study Data
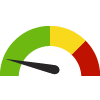
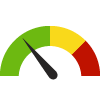
How would you rate the Brown County area in terms of the overall quality of health care?
Value
Compared to:
How would you rate the Brown County area in terms of the overall quality of health care? County: Brown
How would you rate the Brown County area in terms of the overall quality of health care? County: Brown
83.0%
(2021)
Compared to:

Prior Value
(89.0%)
Prior Value compares a measured value with the previously measured value. Confidence intervals were not taken into account in determining the direction of the comparison.
LIFE Study Data
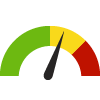
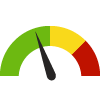
How would you rate the Brown County area in terms of family unable to get mental health care they needed?
Value
Compared to:
How would you rate the Brown County area in terms of family unable to get mental health care they needed? County: Brown
How would you rate the Brown County area in terms of family unable to get mental health care they needed? County: Brown
10.0%
(2021)
Compared to:
Prior Value
(6.0%)
Prior Value compares a measured value with the previously measured value. Confidence intervals were not taken into account in determining the direction of the comparison.
LIFE Study Data
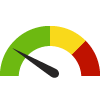
How would you rate the Brown County area in terms of family unable to get health care services they needed?
Value
Compared to:
How would you rate the Brown County area in terms of family unable to get health care services they needed? County: Brown
How would you rate the Brown County area in terms of family unable to get health care services they needed? County: Brown
6.0%
(2021)
Compared to:
Prior Value
(4.0%)
Prior Value compares a measured value with the previously measured value. Confidence intervals were not taken into account in determining the direction of the comparison.
LIFE Study Data
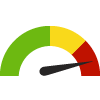
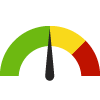
How would you rate the Brown County area in terms of promoting the responsible use of alcohol by residents?
Value
Compared to:
How would you rate the Brown County area in terms of promoting the responsible use of alcohol by residents? County: Brown
How would you rate the Brown County area in terms of promoting the responsible use of alcohol by residents? County: Brown
37.0%
(2021)
Compared to:
Prior Value
(43.0%)
Prior Value compares a measured value with the previously measured value. Confidence intervals were not taken into account in determining the direction of the comparison.
LIFE Study Data
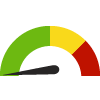
How would you rate the Brown County area in terms of a place where the spiritual health of residents is nurtured?
Value
Compared to:
How would you rate the Brown County area in terms of a place where the spiritual health of residents is nurtured? County: Brown
How would you rate the Brown County area in terms of a place where the spiritual health of residents is nurtured? County: Brown
55.0%
(2021)
Compared to:
Prior Value
(73.0%)
Prior Value compares a measured value with the previously measured value. Confidence intervals were not taken into account in determining the direction of the comparison.
National/ State/ Regional Data
Access to Exercise Opportunities County: Brown
Access to Exercise Opportunities County: Brown
91.1%
(2024)
Compared to:
WI Counties
The distribution is based on data from 72 Wisconsin counties.
U.S. Counties
The distribution is based on data from 3,096 U.S. counties and county equivalents.
WI Value
(83.7%)
The regional value is compared to the Wisconsin State value.
US Value
(84.1%)
The regional value is compared to the national value.
Prior Value
(92.0%)
Prior Value compares a measured value with the previously measured value. Confidence intervals were not taken into account in determining the direction of the comparison.
Adults without Health Insurance County: Brown
Adults without Health Insurance County: Brown
7.2%
(2021)
Compared to:
WI Counties
The distribution is based on data from 72 Wisconsin counties.
U.S. Counties
The distribution is based on data from 3,074 U.S. counties and county equivalents.
US Value
(10.8%)
The regional value is compared to the national value.
HP 2020 Target
(0%)
<div>The Healthy People 2020 national health target is to decrease the proportion of people without health insurance to 0%.</div>
Life Expectancy County: Brown
Life Expectancy County: Brown
79.0
Years
(2019-2021)
Compared to:
WI Counties
The distribution is based on data from 72 Wisconsin counties.
U.S. Counties
The distribution is based on data from 3,070 U.S. counties and county equivalents.
WI Value
(78.2)
The regional value is compared to the Wisconsin State value.
US Value
(77.6)
The regional value is compared to the national value.
National/ State/ Regional Data
Age-Adjusted Death Rate due to Motor Vehicle Collisions
Value
Compared to:
Age-Adjusted Death Rate due to Motor Vehicle Collisions County: Brown
Age-Adjusted Death Rate due to Motor Vehicle Collisions County: Brown
8.5
Deaths per 100,000 population
(2020-2022)
Compared to:

WI Counties
The distribution is based on data from 67 Wisconsin counties.
WI Value
(10.9)
The regional value is compared to the Wisconsin State value.
Prior Value
(7.8)
Prior Value compares a measured value with the previously measured value. Confidence intervals were taken into account in determining the direction of the comparison.
Trend
This comparison measures the indicator’s values over multiple time periods.<br>The Mann-Kendall Test for Statistical Significance is used to evaluate the trend<br>over 4 to 10 periods of measure, subject to data availability and comparability.
Adults who Binge Drink County: Brown
Adults who Binge Drink County: Brown
23.2%
(2020-2022)
Compared to:
WI Counties
The distribution is based on data from 54 Wisconsin counties.
WI Value
(23.4%)
The regional value is compared to the Wisconsin State value.
Prior Value
(25.0%)
Prior Value compares a measured value with the previously measured value. Confidence intervals were taken into account in determining the direction of the comparison.
Trend
This comparison measures the indicator’s values over multiple time periods.<br>The Mann-Kendall Test for Statistical Significance is used to evaluate the trend<br>over 4 to 10 periods of measure, subject to data availability and comparability.
HP 2020 Target
(24.2%)
<div>The Healthy People 2020 national health target is to reduce the proportion of adults aged 18 years and older engaging in binge drinking during the past 30 days to 24.2%.</div>
Age-Adjusted Death Rate due to All Drug Overdose County: Brown
Age-Adjusted Death Rate due to All Drug Overdose County: Brown
26.0
Deaths per 100,000 population
(2022)
Compared to:

WI Value
(32.2)
The regional value is compared to the Wisconsin State value.
Prior Value
(21.5)
Prior Value compares a measured value with the previously measured value. Confidence intervals were taken into account in determining the direction of the comparison.
Trend
This comparison measures the indicator’s values over multiple time periods.<br>The Mann-Kendall Test for Statistical Significance is used to evaluate the trend<br>over 4 to 10 periods of measure, subject to data availability and comparability.
Adults who have had a Routine Checkup County: Brown
Adults who have had a Routine Checkup County: Brown
72.8%
(2021)
Compared to:

WI Counties
The distribution is based on data from 72 Wisconsin counties.
U.S. Counties
The distribution is based on data from 3,074 U.S. counties and county equivalents.
US Value
(73.6%)
The regional value is compared to the national value.
National/ State/ Regional Data
Adults 65+ who Received Recommended Preventive Services: Females
Value
Compared to:
Adults 65+ who Received Recommended Preventive Services: Females County: Brown
Adults 65+ who Received Recommended Preventive Services: Females County: Brown
34.3%
(2020)
Compared to:
WI Counties
The distribution is based on data from 72 Wisconsin counties.
U.S. Counties
The distribution is based on data from 3,141 U.S. counties and county equivalents.
US Value
(37.9%)
The regional value is compared to the national value.
National/ State/ Regional Data
Adults 65+ who Received Recommended Preventive Services: Males
Value
Compared to:
Adults 65+ who Received Recommended Preventive Services: Males County: Brown
Adults 65+ who Received Recommended Preventive Services: Males County: Brown
35.9%
(2020)
Compared to:
WI Counties
The distribution is based on data from 72 Wisconsin counties.
U.S. Counties
The distribution is based on data from 3,141 U.S. counties and county equivalents.
US Value
(43.7%)
The regional value is compared to the national value.
National/ State/ Regional Data
Age-Adjusted Death Rate due to Alzheimer's Disease
Value
Compared to:
Age-Adjusted Death Rate due to Alzheimer's Disease County: Brown
Age-Adjusted Death Rate due to Alzheimer's Disease County: Brown
33.6
Deaths per 100,000 population
(2020-2022)
Compared to:

WI Counties
The distribution is based on data from 69 Wisconsin counties.
WI Value
(31.6)
The regional value is compared to the Wisconsin State value.
US Value
(32.4 in 2020)
The regional value is compared to the national value. The source for the national value is Centers for Disease Control and Prevention
Prior Value
(31.5)
Prior Value compares a measured value with the previously measured value. Confidence intervals were taken into account in determining the direction of the comparison.
Trend
This comparison measures the indicator’s values over multiple time periods.<br>The Mann-Kendall Test for Statistical Significance is used to evaluate the trend<br>over 4 to 10 periods of measure, subject to data availability and comparability.
Adults who are Sedentary County: Brown
Adults who are Sedentary County: Brown
19.5%
(2020-2022)
Compared to:
WI Counties
The distribution is based on data from 57 Wisconsin counties.
WI Value
(20.2%)
The regional value is compared to the Wisconsin State value.
Prior Value
(14.6%)
Prior Value compares a measured value with the previously measured value. Confidence intervals were taken into account in determining the direction of the comparison.
Trend
This comparison measures the indicator’s values over multiple time periods.<br>The Mann-Kendall Test for Statistical Significance is used to evaluate the trend<br>over 4 to 10 periods of measure, subject to data availability and comparability.
HP 2020 Target
(32.6%)
HP 2030 Target
(21.8%)
Adults who Smoke County: Brown
Adults who Smoke County: Brown
13.3%
(2020-2022)
Compared to:
WI Counties
The distribution is based on data from 56 Wisconsin counties.
WI Value
(15.1%)
The regional value is compared to the Wisconsin State value.
Prior Value
(11.9%)
Prior Value compares a measured value with the previously measured value. Confidence intervals were taken into account in determining the direction of the comparison.
Trend
This comparison measures the indicator’s values over multiple time periods.<br>The Mann-Kendall Test for Statistical Significance is used to evaluate the trend<br>over 4 to 10 periods of measure, subject to data availability and comparability.
HP 2020 Target
(12.0%)
HP 2030 Target
(6.1%)
<div>TU-02: Reduce current cigarette smoking in adults <strong>(LEADING HEALTH INDICATOR)</strong></div>
Adults Who Are Obese County: Brown
Adults Who Are Obese County: Brown
32.9%
(2020-2022)
Compared to:
WI Counties
The distribution is based on data from 57 Wisconsin counties.
WI Value
(31.5%)
The regional value is compared to the Wisconsin State value.
Prior Value
(32.2%)
Prior Value compares a measured value with the previously measured value. Confidence intervals were taken into account in determining the direction of the comparison.
Trend
This comparison measures the indicator’s values over multiple time periods.<br>The Mann-Kendall Test for Statistical Significance is used to evaluate the trend<br>over 4 to 10 periods of measure, subject to data availability and comparability.
HP 2020 Target
(30.5%)
<div>The Healthy People 2020 national health target is to reduce the proportion of adults aged 20 and older who are obese to 30.5%.</div>
Adults who are Overweight County: Brown
Adults who are Overweight County: Brown
32.5%
(2020-2022)
Compared to:
WI Counties
The distribution is based on data from 57 Wisconsin counties.
WI Value
(30.8%)
The regional value is compared to the Wisconsin State value.
US Value
(34.1% in 2022)
The regional value is compared to the national value. The source for the national value is Behavioral Risk Factor Surveillance System
Prior Value
(33.0%)
Prior Value compares a measured value with the previously measured value. Confidence intervals were taken into account in determining the direction of the comparison.
Trend
This comparison measures the indicator’s values over multiple time periods.<br>The Mann-Kendall Test for Statistical Significance is used to evaluate the trend<br>over 4 to 10 periods of measure, subject to data availability and comparability.
